Quick Facts
- H1 2026 Projection: Brazil is expected to export 12.3 million metric tons of soymeal, trailing closely behind Argentina’s 13.3 million metric tons.
- Market Shift: The export dominance gap is closing rapidly, with Argentina's lead shrinking from 86% in 2021 to a projected 8% by mid-2026.
- Core Growth Driver: Brazil's B15-B20 biodiesel mandates are the primary catalyst, forcing higher oil production which creates a structural surplus of soymeal.
- Record Harvests: Brazil’s 2026 soybean harvest is forecast at a record-breaking 186.0 million metric tons, providing ample feedstock for domestic processors.
- Crush Alpha: A standard processing yield produces 44 lbs of meal and 11 lbs of oil from every 60 lb bushel of soybeans, a critical metric for assessing profitability.
- Historical Context: Brazil briefly took the top spot in the 2022/2023 marketing year due to a severe drought in Argentina, signaling a permanent shift in competitive dynamics.
Brazil's growth in soybean crushing is primarily driven by increasing domestic demand for soybean oil to meet higher biodiesel mandates. As industrial oil use rises, large volumes of soymeal are produced as a byproduct, allowing Brazil to approach parity with Argentina in the global export market.
As the global agricultural landscape shifts in June 2026, the question of whether Brazil will overtake Argentina in soybean crushing has reached a fever pitch. With export margins tightening and biodiesel mandates driving industrial demand, the 'Soymeal King' title is up for grabs. For the strategic investor, this is not merely a regional rivalry; it represents a fundamental realignment of how value-added processing dictates global flow. While Argentina has long been the undisputed leader in protein meal exports, Brazil’s transition from a volume-heavy raw bean exporter to a sophisticated oilseed processing hub is rewriting the rulebook of South American agriculture.
The Great Convergence: 2026 Export Data Analysis
The historical gap between these two agricultural titans is narrowing at a rate few analysts predicted five years ago. For decades, Argentina sat comfortably at the top, benefiting from a tax regime that incentivized the export of meal and oil over raw beans. However, recent volatility, climate disruptions, and shifting domestic policies have leveled the playing field.
In the 2022/2023 marketing year, a landmark shift occurred. Brazil surpassed Argentina to become the world's leading soymeal exporter for the first time in 25 years, shipping 21.5 million metric tons after a severe drought reduced Argentina's soybean crop by approximately 50%. While this was initially viewed as an anomaly caused by climate stress, subsequent marketing years suggest a more permanent trend toward market parity.
For the upcoming 2023/2024 season, Argentina is forecast to reclaim its top position with a projected 34.8% share of the global soymeal export market, while Brazil’s share is expected to decline from 31.7% to 29.4%. However, these percentages mask the underlying volume growth within Brazil. By the first half of 2026, projections indicate the export gap between the two nations is narrowing significantly. Total shipments show 12.3 million metric tons of soymeal compared to 13.3 million metric tons from Argentina.
| Metric (H1 2026 Est.) | Brazil | Argentina |
|---|---|---|
| Projected Soymeal Exports | 12.3 Million Metric Tons | 13.3 Million Metric Tons |
| Soy Harvest Area Forecast | 47.5 Million Hectares | 17.8 Million Hectares |
| Primary Market Driver | Domestic Biodiesel Mandates | Export Tax Incentives |
| Yield Efficiency | High (Modernized Plants) | High (Concentrated Hubs) |
| Logistics Constraints | Inland Transport Costs | Currency/Port Volatility |
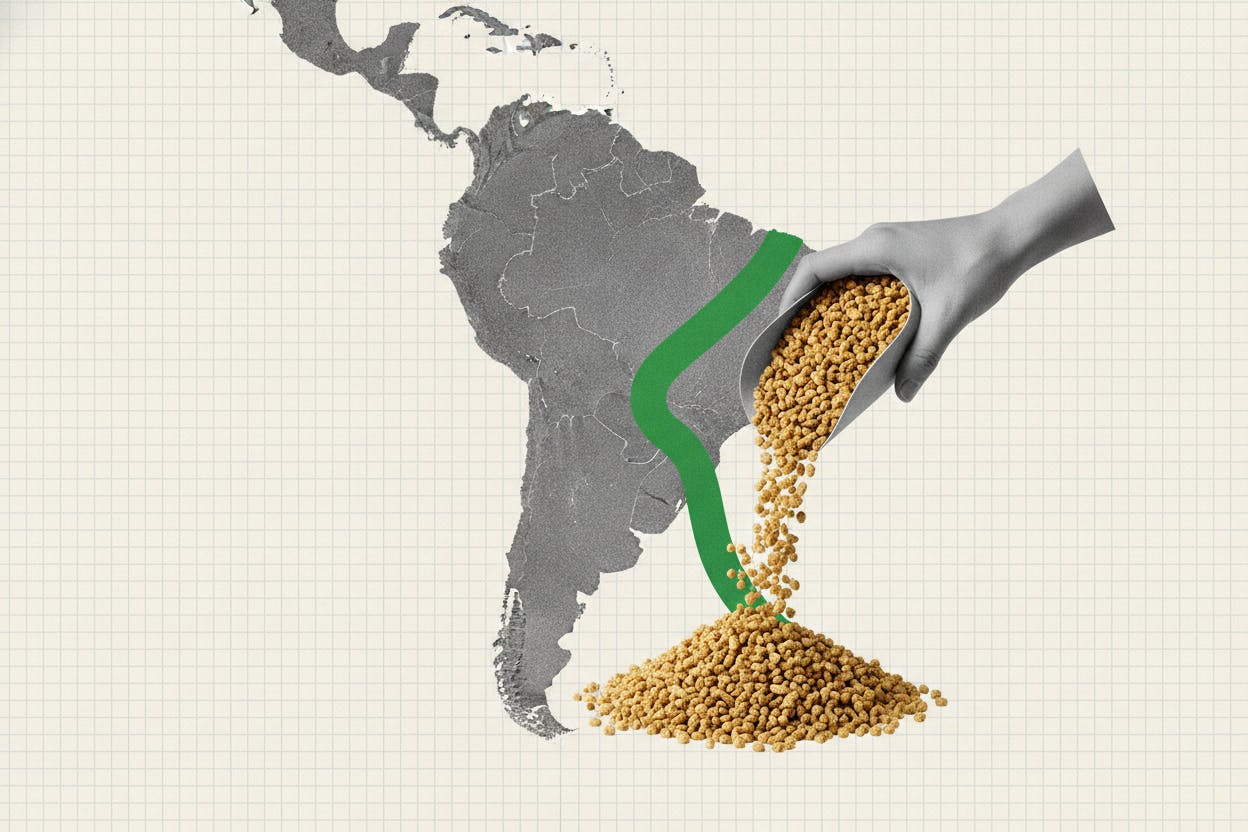
The ability of Brazil to maintain a high level of protein meal exports even during Argentine recovery years highlights a structural change. Brazil is no longer just selling raw commodities; it is building out its processing capacity to capture the value-added margin at home. Through the lens of a soybean meal price comparison Brazil vs Argentina, we see that Brazil is increasingly competitive on the global stage, leveraging its massive production base to keep units moving even when global prices fluctuate.
The Economics of the Crush: Spreads and Margins
Understanding the competition between these two nations requires a deep dive into the soybean crush spread. This metric represents the gross margin captured by turning raw soybeans into meal and oil. For a processor, the profit is found in the difference between the cost of the raw beans and the revenue generated from the derivative products.
The industry standard for calculating the soybean crush price involves a specific extraction yield. When one 60-pound bushel of soybeans is processed, it typically yields approximately 44 pounds of meal and 11 pounds of oil. The remaining weight represents hulls or moisture loss.
The Soybean Crush Formula
To calculate the gross margin (the spread), processors and investors use the following weight-based multipliers:
- Gross Crush Spread = (11 x Price of Oil) + (44 x Price of Meal / 2000) - (Price of Soybeans)
- Note: Prices for meal are typically quoted in dollars per short ton, requiring a conversion to match the per-bushel soybean price.
Market participants rely heavily on a soybean crush margin chart to identify when processing is overvalued or undervalued relative to historical norms. As we move closer to 2026, forecasting 2026 soybean crush spreads suggests that margins will be increasingly sensitive to the value of oil. In periods where soymeal prices are soft due to global protein gluts, processors become more dependent on soybean oil values to maintain profitability. This dynamic directly impacts the prices they offer to farmers for raw beans, creating a ripple effect through the entire supply chain.
For portfolio managers, soybean crushing acts as a bellwether for the health of the agro-industrial complex. If the spread remains robust, processing capacity continues to expand, which in turn leads to higher demand for raw agricultural logistics and storage infrastructure.
Structural Drivers: Biodiesel vs. Traditional Meal Demand
The catalyst for Brazil's aggressive entry into the protein market is not actually the meal itself, but the oil. Brazil has committed to ambitious renewable fuel standards to lower its carbon footprint and reduce reliance on imported fossil fuels. These Biodiesel mandates have created a massive domestic appetite for soybean oil.
The impact of Brazil biodiesel on soymeal supply is perhaps the most critical factor for 2026. Because soybean oil and meal are produced in a fixed ratio, an increase in oil production for biodiesel naturally creates a surplus of meal. Even if global livestock demand remains flat, Brazil must produce more soymeal to meet its fuel requirements. This "byproduct-driven" supply makes Brazil a formidable competitor, as they may be willing to sell meal at lower prices just to keep the oil flowing into their fuel tanks.
Factors influencing soybean crush price movements in 2026 include:
- Regional Renewable Fuel Standards: Brazil’s move toward B20 (20% biodiesel blend) is non-negotiable for large-scale processors.
- Livestock Feed Requirements: The growth of poultry and pork production in Asia remains the primary floor for global soymeal prices.
- Environmental Regulations: Land usage rights and ESG (Environmental, Social, and Governance) compliance are becoming a fixed cost of doing business in the Amazon and Cerrado biomes.
- Shipping Logistics: Improvements in Brazil's "Northern Arc" ports are reducing the transit cost, bringing Brazilian soymeal closer to price parity with Argentine products shipped from the Rosario Grain Exchange.
While Brazil is oil-driven, Argentina remains export-driven. Almost all of Argentina's processing capacity is clustered around the Parana River, designed specifically for efficient global shipping. This concentrated infrastructure gives Argentina a geographic advantage, but it also leaves them vulnerable to domestic economic policies and currency fluctuations that don't affect Brazil in the same way.
Competitive Outlook: Policy Hurdles and Logistics
As we look toward the 2026/2027 marketing year, the battle for the title of "Global Soymeal King" will be decided by policy as much as by production. Argentina is currently in a state of flux with its export tax policies. Historically, a lower tax on meal versus raw beans protected the local industry. If these tax structures are altered to generate immediate government revenue, the Argentine processing sector could lose its competitive edge overnight.
Conversely, Brazil faces the challenge of interior logistics. Getting meal from Mato Grosso to the coast is a long and expensive journey. However, massive investments in rail and waterway corridors are beginning to pay off. The maturation of Brazil from a raw bean exporter to a value-added processor is nearly complete. With a 2026 harvest forecast at 186.0 million metric tons, the sheer scale of Brazil’s raw material availability provides a cushion that Argentina simply doesn't have.
Market parity is the most likely outcome for the late 2020s. We are entering an era of a "duopoly" where the global protein supply is balanced on a knife-edge between Brazil's industrial oil needs and Argentina's traditional export dominance. For long-term investors, the focus should be on those companies that control the processing facilities in both nations, effectively hedging against the specific risks—whether climatic or political—of either side.
FAQ
What is soybean crushing?
Soybean crushing is the industrial process of breaking down raw soybeans into their primary components: high-protein meal and vegetable oil. This is typically achieved through cleaning, cracking, heating, and solvent extraction or mechanical pressing. The process is the foundation of the global animal feed and biodiesel industries.
What is the soybean crush strategy?
The soybean crush strategy is a commodity trading approach used by processors and speculators to manage price risk. It involves taking simultaneous positions in soybean, soybean meal, and soybean oil futures to lock in a processing margin. For example, a processor might buy soybean futures and sell meal and oil futures to protect themselves against a narrowing spread that would reduce their profitability.
What is the formula for soybean crush?
The standard formula compares the value of the processed products to the cost of the raw soybeans using a specific weight ratio. Generally, one bushel of soybeans (60 lbs) yields 44 lbs of meal and 11 lbs of oil. The formula is expressed as: (Price of Meal per ton x 0.022) + (Price of Oil per lb x 11) - Price of Soybeans per bushel. This allows for a direct comparison of all three commodities in a single dollar-per-bushel value.
The Final Verdict for 2026/27
While Argentina will likely reclaim the top spot in the short term as it recovers from the 2023 drought, the long-term momentum favors Brazil. The structural shift driven by domestic fuel mandates means Brazil's processing capacity is no longer tied solely to global feed demand. This diversification makes the Brazilian oilseed processing sector more resilient.
For the 2026/27 marketing year, the crown may stay in Rosario by a slim margin, but the power center of the global agricultural market has undeniably shifted toward Brasília. Investors should watch the soybean crush price closely; as Brazil’s infrastructure improves, the "Brazilian discount" will disappear, and the era of Argentine dominance will transition into a cooperative—yet fiercely competitive—South American parity.