Quick Facts
- Market Pulse: Global stock indices remained flat as of mid-April 2026, with the S&P 500 showing a neutral year-to-date performance.
- Energy Benchmarks: Brent crude futures are trading near $96.02 per barrel, while the U.S. benchmark WTI is holding steady at approximately $92.31.
- Geopolitical Catalyst: Mediators are currently working to extend a critical two-week ceasefire between the United States and Iran following the April 15 milestone.
- Sector Leader: The XLE Energy ETF has outperformed the broader market by +33%, fueled by robust cash flows and high operating leverage.
- Valuation Gap: Industry analysts highlight a 30% valuation gap in small-cap energy equities compared to historical oil-linked fair value.
- Inflation Signal: Rising energy costs drove a significant jump in the March Consumer Price Index (CPI), complicating the outlook for rate cuts.
Rising oil prices stock market fluctuations increase inflationary pressure, leading to higher fuel and freight costs that squeeze corporate margins across the consumer and industrial sectors. This volatility often impacts rate-sensitive sectors like technology, while the energy sector typically benefits from higher crude prices, consistently outperforming the broader market during geopolitical supply shocks in regions like the Middle East.
The Geopolitical Standoff: US-Iran Talks and Market Stagnation
The global financial landscape in April 2026 is currently defined by a delicate diplomatic dance. As mediators worked to extend a ceasefire between the United States and Iran, U.S. stock index futures for the S&P 500, Dow Jones Industrial Average, and Nasdaq all declined by less than 0.1% on April 15, 2026. This minute fluctuation reflects a market that is essentially holding its breath. While the immediate threat of escalation has cooled, the underlying geopolitical risk premium remains embedded in the price of every barrel of oil moving through the Strait of Hormuz.
For investors, the stagnation in the broader indices is a classic sign of uncertainty. By the middle of April 2026, the S&P 500 was reported to be flat on the year as global stock markets rebounded from earlier lows following the announcement of a temporary ceasefire. However, "rebounded to flat" is hardly a ringing endorsement of economic tailwinds. The market is pricing in a binary outcome: either diplomatic talks lead to a structural de-escalation, or we see a return to shipping disruptions that could send Brent crude futures well into the triple digits.
The viability of the Strait of Hormuz remains the decisive factor for global energy security. Any hint of renewed friction in these shipping lanes immediately offsets the optimism generated by diplomatic talks. Currently, the market is navigating what we call a war premium decay, where prices refuse to drop to pre-conflict levels because the risk of a sudden supply chain disruption remains too high to ignore.
The Energy Paradox: Why Equities Lag Spot Prices
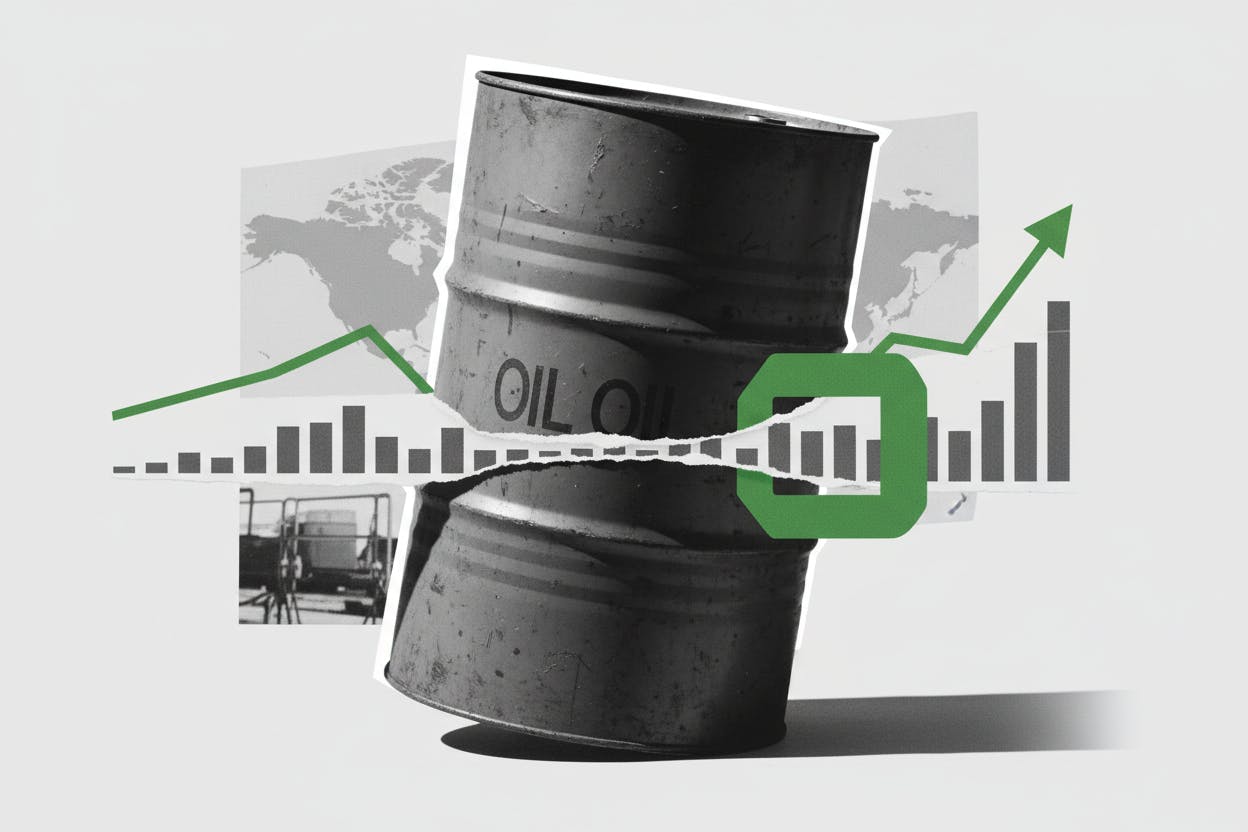
One of the most intriguing aspects of the current market is the disconnect between the live crude oil price in dollar terms and the valuation of the companies that extract it. Despite benchmark U.S. crude oil trading at approximately $92.31 per barrel in mid-April 2026, many energy equities are not yet reflecting the full extent of this pricing environment.
This pricing disconnect has created what some analysts call an energy paradox. According to recent insights, there is a roughly 30% valuation gap in certain segments of the energy sector. While massive players like ExxonMobil and Occidental Petroleum have seen significant gains in 2026, smaller exploration and production (E&P) firms are trading significantly below their historical oil-linked fair value.
Several factors contribute to this lag:
- The Brent-WTI Spread: The spread has widened to between $10 and $20 in recent weeks, complicating the earnings outlook for companies with diverse geographic footprints.
- Capital Discipline: Investors are no longer rewarding growth at any cost. Even with oil at $90+, many firms are prioritizing debt reduction and share buybacks over new drilling, which limits the explosive stock price growth seen in previous cycles.
- ESG Pressures: Long-term institutional outflows from fossil fuels continue to act as a ceiling on valuation multiples, even as short-term cash flows reach record highs.
Monitoring an oil price chart reveals a steady upward trajectory since the start of the year, yet the crude oil stock prices today suggest a market that is skeptical of the longevity of these high prices. For the savvy portfolio strategist, this gap represents an opportunity. If oil remains above $85 for the remainder of the year, the "catch-up" trade for energy stocks could be the most profitable move of the second half of 2026.
| Metric | Current Value (April 2026) | Trend |
|---|---|---|
| Brent Crude | $96.02 | Cautious Stability |
| WTI Crude | $92.31 | Cautious Optimism |
| S&P 500 YTD | ~0.0% | Flat |
| Energy Sector (XLE) | +33% | Outperforming |
Macro Transmission: From Oil Spikes to Margin Compression
The impact of oil prices stock market volatility extends far beyond the gas station. We are currently witnessing a classic macro transmission of energy shocks through the global economy. The March CPI data showed a significant jump, driven almost entirely by the rising cost of energy and subsequent supply chain disruption. This has forced a repricing of expectations for the Federal Reserve’s monetary policy tightening cycle.
How oil prices affect the stock market is most visible in the "margin squeeze" experienced by non-energy sectors. When the live crude oil price in dollar terms spikes, it acts as a regressive tax on both consumers and corporations.
- Consumer Goods: Higher fuel costs lead to increased freight surcharges, which are either absorbed by the company (lowering earnings) or passed to the consumer (lowering demand).
- Technology Stocks: The impact of oil price volatility on tech stocks is primarily through the discount rate. Higher oil leads to higher inflation, which leads to higher interest rates. Since tech valuations are heavily dependent on future cash flows, higher rates decrease their present value.
- Industrials: Companies like Boeing or Caterpillar face a double whammy: higher raw material costs and increased operational expenses for their global logistics networks.
Even high-flying tech leaders like TSMC have seen their strong earnings guidance overshadowed by the broader market concern over rate repricing. As long as energy prices remain elevated, the "higher for longer" interest rate narrative will continue to cap the upside for the broader S&P 500.
Portfolio Strategy: Navigating the 2026 Energy Market
In this environment of geopolitical tension and inflationary pressure, a one-size-fits-all approach to investing in oil stocks during geopolitical conflict is insufficient. Investors must choose between protecting their downside and aggressively pursuing the valuation gap.
Conservative Allocation Template
For investors who prioritize capital preservation but want a hedge against further energy shocks:
- Energy Weighting: 10-15% of total portfolio.
- Primary Vehicles: Large-cap energy ETFs like XLE or VDE.
- Focus: High-yield stocks and Master Limited Partnerships (MLPs) like MPLX, which currently offers a 7.29% yield. These provide steady income even if the oil price chart enters a period of consolidation.
- Hedge: Short-duration Treasury bonds to offset potential interest rate spikes if inflation persists.
Aggressive Allocation Template
For investors looking to capitalize on the 30% valuation gap and potential supply shocks:
- Energy Weighting: 20-25% of total portfolio.
- Primary Vehicles: Small-cap E&P stocks or targeted exploration ETFs.
- Focus: Companies with high operating leverage to the WTI benchmark. Look for firms with unhedged production that can capture the full upside of the $92+ per barrel environment.
- Specific Tickers: Consider monitoring exxon oil stock prices as a benchmark for the sector, but look toward names with significant Permian Basin exposure for higher growth potential.
Comparing energy etfs vs s&p 500 performance reveals that the sector rotation into energy is already well underway. However, given the looming April 6 deadline regarding the Strait of Hormuz and the ongoing US-Iran talks, maintaining a portion of the portfolio in cash or liquid instruments allows for tactical buying if a temporary "peace dip" occurs.
FAQ
Is there a stock that tracks oil prices?
While no single stock perfectly tracks the spot price of crude, the United States Oil Fund (USO) is an exchange-traded security designed to track the daily price movements of WTI light, sweet crude oil. For equity-based tracking, the Energy Select Sector SPDR Fund (XLE) provides broad exposure to large-cap companies whose earnings are highly correlated with energy prices.
Is oil expected to go up or down?
As of April 2026, the short-term outlook is "cautiously elevated." While US-Iran talks may provide temporary relief, the structural supply deficit and the ongoing geopolitical risk premium suggest that oil is more likely to remain in the $90-$100 range than to see a significant drop. Any breakdown in diplomatic negotiations could quickly push prices toward $110.
Which oil stock is best to buy now?
For long-term investors, ExxonMobil remains a premier choice due to its robust balance sheet and diversified operations. However, for those looking to exploit the current valuation gap, mid-tier producers with low debt-to-equity ratios and high dividend yields are currently offering the best risk-adjusted returns in the 2026 market.
Is oil going to crash in 2026?
A total crash is unlikely given the current global energy security environment and limited spare capacity among OPEC+ members. While a successful long-term ceasefire between the US and Iran could see a $10-$15 "risk premium" evaporate, the fundamental demand from emerging markets and the slow pace of the energy transition continue to provide a strong floor for prices.
Conclusion: Watching the April Deadline
The coming weeks will be critical for determining the trajectory of the 2026 market. Investors should keep a close eye on the April 6 deadline regarding the Strait of Hormuz, as any shift in transit viability will immediately impact the oil prices stock market dynamic.
While the US-Iran talks have kept global stocks flat for now, the underlying strength of the energy sector cannot be ignored. Whether you choose a conservative hedge or an aggressive play on the valuation gap, the key is to remain risk-aware. Monitor the Brent-WTI spread and stay prepared for volatility as the geopolitical landscape continues to shift. Success in this environment requires moving beyond the headlines and focusing on the structural supply-demand imbalances that define our current era of global energy.